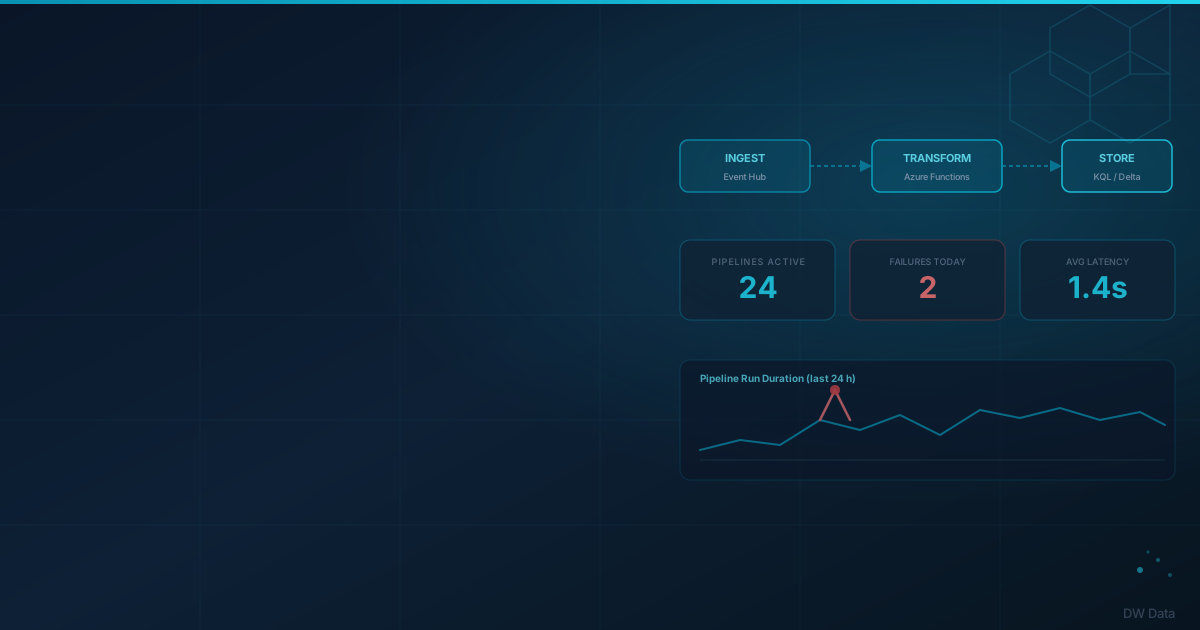
Fabric Pipeline Monitor
Real-time observability dashboard for Microsoft Fabric data pipelines, surfacing failures, latency anomalies, and cost spikes before they impact downstream consumers.
Problem Solved
Data engineering teams running large Microsoft Fabric estates spend hours each week manually reviewing pipeline run logs spread across multiple workspaces. By the time a failure surfaces in a downstream report, the root cause is buried under hours of retries, and the business has already lost confidence in the data.
This app centralises all pipeline telemetry into a single observability layer — giving engineers one screen to catch failures, trace lineage, and quantify the blast radius of any incident in real time.
Key Features
Live Pipeline Health Feed
Streams Fabric activity logs via Azure Event Hub into a KQL store, refreshing the dashboard every 30 seconds without polling costs.
Anomaly Detection
A lightweight Z-score model flags duration spikes and row-count drops as they occur, alerting on-call engineers before SLA windows close.
Workspace-Level Cost Attribution
Maps every pipeline run to a capacity unit cost, enabling chargeback reporting by team and project with no manual tagging.
Lineage Drill-Through
Click any failed activity to traverse the full upstream dependency graph and identify the originating data source in seconds.
Architecture
Architecture Overview
Fabric's built-in monitoring APIs emit run events to an Azure Event Hub trigger. An Azure Function enriches each event with workspace metadata and writes it to a Fabric KQL Database (Eventhouse). Power BI connects via DirectQuery for sub-minute refresh without import-mode refresh cycles.
A nightly Python job materialises a summary Delta table used by the cost-attribution report, keeping ad-hoc queries off the hot path.
- Ingestion: Azure Event Hub → Azure Functions (Python)
- Storage: Fabric Eventhouse (KQL) + Delta Lake for historical summaries
- Serving: Power BI DirectQuery + Fabric Real-Time Dashboard
- Alerting: Logic App → Teams webhook on anomaly score threshold
Key Decisions
KQL over SQL for real-time queries
KQL's native time-series functions (series_decompose_anomalies, make-series) reduced anomaly detection query complexity from 80-line SQL to 4-line KQL, and run 10× faster on streaming data.
DirectQuery over Import mode
Pipeline failures must be visible within seconds. Import-mode scheduled refresh (minimum 30 min in Power BI) would miss entire incident windows, so DirectQuery was the only viable choice despite higher query load.
Separate cold-path Delta table for cost reports
Cost attribution queries scan months of history and join multiple large tables — unsuitable for KQL's hot-path store. A nightly Spark job aggregates into Delta, keeping cost reports fast without polluting the real-time tier.
Screenshots
Interested in something similar?
We scope, design, and ship data and AI tools that solve the problems your team actually has.
Let's Talk